Two equations have been frequently used to describe the relation
between the sample variance (s2) and sample mean (m)
of the number of individuals per quadrat: Taylor's power law, s2=amb,
and Iwao's m*-m regression, s2 = cm + dm2,
where a, b, c, and d are constants. We can obtain
biological information such as the colony size and the degree of aggregation
of
colonies from the parameters c and d of Iwao's m*-m regression.
However, we cannot obtain such biological information from the parameters a and b of
Taylor's power law since these parameters have not been described by simple functions.
To mitigate such inconvenience, I propose a mechanistic model
that produces Taylor's power law; it is called the colony expansion model. This
model has the following two assumptions: (1) Population consists of a fixed number
of colonies that lie across several quadrats. (2) The number of individuals per
unit occupied area of colony becomes v times larger in an allometric manner
when the occupied area of colony becomes h times larger (v >= 1, h >= 1). The parameter h indicates the dispersal rate of organisms. We
then obtain Taylor's power law with b = {ln[E (h )] + ln[E (v2)]}/{ln[E(h )
+ ln[E (v )]],
where E indicates the expectation. We can use the inverse of exponent, 1/b,
as an index of dispersal of individuals since it increases with increasing E (h ).
This model also yields a relation, which is known as the Kono-Sugino relation,
between the proportion of occupied quadrats and the mean density per
quadrat: - ln(1 - p ) = fmg, where p is the proportion
of occupied quadrats, f is a constant, and g = ln[E (h )]/{ln[E (h )]
+ ln[E (v )]}. We can use g as an index of dispersal
since it increases with increasing E(h). The problem at low densities
where Taylor's power law cannot be applicable is also discussed. (Copyright by
the Society of Population Ecology and Springer-Verlag Tokyo)
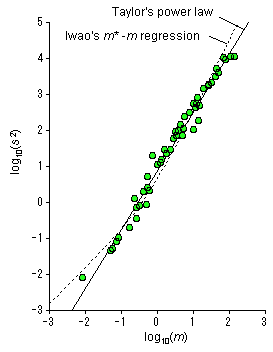
Figure 1. Example of Taylor's power law. The variance-mean relation for the number
of citrus red mite Panonychus citri per tree is shown. Estimated equations
are as follows. Taylor's power law: s2 = 8.234m1.625, r2=0.982) Iwao's m*-m regression: s2 = 1.554m + 3.415m2(r2=0.965). (Copyright
by the Society of Population Ecology and Springer-Verlag Tokyo)
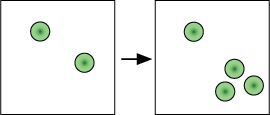
Iwao's (1968) model
Colony expansion model
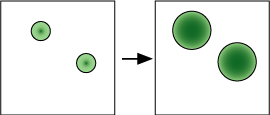
Figure 2. Schematic illustration of the assumptions of the model. Circles indicate
colonies. Shade of the color indicates the density at that point. In Iwao's (1968)
model, the population increase is described by the increase in the number of colonies
while the colony size is fixed (upper). In the colony expansion mode, by contrast,
the population increase is described by the development of each colony while the
number of major colonies is fixed (lower). (Copyright by the Society of Population
Ecology and Springer-Verlag Tokyo)