We develop a mechanistic model for pollen dispersal by a generalization of the
Brownian motion model. This model provides an explanation as to why the probability
distribution of the dispersal distance is leptokurtic in most organisms. The
pollen is assumed to move in a period between t and t + Dt to
the circumference
of a circle of radius Drt that
has a center at the current position. The angle of movement is chosen at random.
Unlike the conventional Brownian motion model,
the step length, Drt,
fluctuates in a stochastic manner, obeying a generalized gamma distribution.
The convection flow, i.e., the directional movement of pollen,
is also considered. It is shown that this model is identical to
the diffusion model where the dispersal duration weighted by the diffusion coefficient
obeys a gamma distribution. Hence, the model is called the gamma model. The solution
is given in an explicit form. The model is fitted to the 6 data sets obtained
from the literature by maximizing the quasi-likelihood. Another model (the inverse
gamma model), which is not a mechanistic model but a phenomenological model,
is also fitted to the data to evaluate the validity of the gamma model.
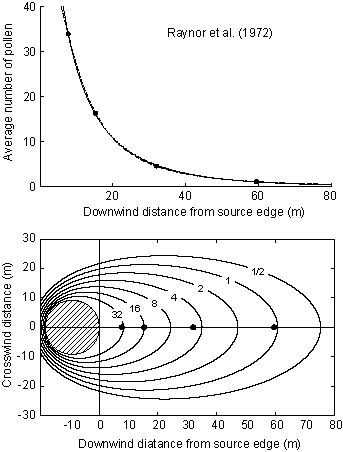
Figure 1. Estimated curves for the data of Raynor et al. (1972;
Agron J 64:420-427). Upper panel: Comparison between two models. The solid curve
indicates the gamma model. The dotted curve indicates the inverse gamma model.
Black dots indicate the observed average number of pollen grains captured by
slides per 1 cm2 per day. The quantity is given by the percentage relative to
the number of pollen grains captured at 1 m distance. Only the data used in the
estimation of parameters are shown. Lower panel: Estimated contours of the average
number of pollen grains. Black dots indicate the position of pollen samplers
that were used in the estimation of parameters. The hatched circle indicates
the pollen source. (Copyright by the Society
of Population Ecology and Springer-Verlag Tokyo).