Detection of GMOs
The food safety has recently occupied considerable public attention. The pesticide residue was detected from imported vegetables repeatedly. The unintentional mingling of genetically modified organisms (GMOs) with non-GMOs is also one of concerns of consumers. In 2000, StarLink corn, one of the genetically modified corn that yields Bt toxins against lepidopteran pests, was detected from the imported corn meal in Japan by a consumer group. The detection of GMOs is being performed by Plant Quarantine Station in Japan since 2004.
Risk management
In the current import plant quarantine regulation in Japan, we regulate the risk so that ‘a consignment that contains infected plants by a proportion larger than a level p is detected by a probability larger than (1 - β)’. The level p is the threshold proportion of infected plants above which we cannot tolerate. The probability β corresponds to ‘consumer’s risk’. In this risk management procedure, the undesirable event is ‘importing a consignment of a infection rate larger than p into Japan’, and we are managing the probability of occurrence of undesirable events within a probability β. Then, the required sample size (s) to achieve the risk management is given by Problem of the threshold of detection
Testing the units one-by-one is inefficient when very few of them are defective and
they are cheap relative to the cost of the test. In such cases, it is often preferable to form
groups of units, and test all units in a group imultaneously. This procedure is usually called
”group testing” in the statistical literature (Chen and Swallow, 1990). Group testing procedure is also used for detecting GMOs. However,
we meet difficulties in applying group testing. We must first determine two parameters in
applying group testing procedures: the number of units within a group, which is denoted
by n, and the number of groups in the testing procedure, which is denoted by w. We are
using ELISA or PCR (polymerase chain reaction) in detecting GMOs. These analytical
instruments, as well as other instruments, have their threshold of detection below which the
existence of the subject material is not detected. If the group size (n) is large, the material
will not be detected even if the group contains one defective unit, because the material ishighly diluted. Optimal sampling design
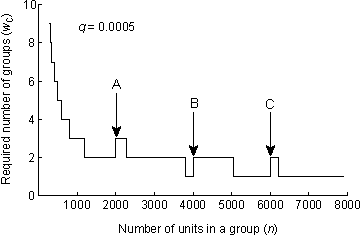
We can calculate the optimal sampling design by using the proposed method. Figure 1 shows the sampling design that is required to achieve p = 0.125% for q = 0.05%. The horizontal axis indicates the number (n ) of units used in a test. The vertical axis indicates the required number of tests (w ). The risk of contamination is kept at a specified level if we use the sample size on the broken line in Fig. 1. The sampling design, n = 1200 and w = 2, lies on the broken line, and hence the risk is correctly managed in this design. However, we can find better design in some cases. If we use 4,000 grains in a test, we have w = 1, that is, the number of test is 1. Therefore, this design will be preferable if the cost required for performing a test is expensive as compared to the cost for preparing the test portion. Magic by randomization
Let us consider a case where we want to detect the contamination of 0.125% but we have only an
instrument that cannot detect the contamination less than 0.25%. At first sight, it seems impossible to manage the risk. However,
we can do magic by using randomization; we can detect any small contamination by repeating the tests. The number of test to detect
a contamination of 0.125% is given by Fig. 2.
References
Chen, C. L., and Swallow, W. H. (1990). Using group testing to estimate a proportion, and
to test the binomial model. Biometrics, 46, 1035-1046.
![]() ...............................................................(1)
...............................................................(1)
US Federal Grain Inspection Service has adopted 2,400 grains as the standard sample
size for StarLink testing (USDA Federal Grain Inspection Service, 2001). This sample size corresponds to the case of β = 0.05 and p = 0.00125 in Eq. 1. The Ministry of Health, Labor and Welfare of Japan and
the Ministry of Agriculture, Forestry and Fisheries
in Japan adopted the same criteria as USDA.
In a PCR testing for StarLink corn that is provided by Matsuoka et al. (2001), the threshold of detection (q ) is 0.05%. Hence, we cannot detect the StarLink corn when we mix the 2,400 grains to prepare the test portion even if one grain of StarLink corn exists in the 2,400 grains. Hence, 2,400 gains are divided into two parts 1200 grains each. Then, PCR testing is performed for each of the two groups. Then, the 'lot' (consignment) is judged as successful if no StarLink corn is detected in the two tests; we can judge that the proportion of StarLink is less than 0.125% in this case. However, we cannot know the proportion of StarLink corn if, for example, the StarLink is detected in one of the two groups.
We developed a procedure to
estimate the proportion of defective units for any group size even if a threshold of detection
exists; the estimate of the proportion of defective units is easily obtained by using functions implemented in a spreadsheet. The example sheet is given here (Estimation_of_proportion.xls) . If the StarLink is detected in one of the two tests in the above procedure, for example, the proposed method shows that the proportion of StarLink is less than 0.31% in this case.

Matsuoka, T., H. Kuribara, S. Suefuji, H. Miura, Y. Kusakabe, H. Akiyama, Y. Goda, K. Isshiki, M. Toyoda, and A. Hino (2001) A detection method for recombinant DNA from genetically modified maize CBH351. Shokuhin Eiseigaku Zasshi (J Food Hyg. Soc. Japan) 42:197-201.
USDA Federal Grain Inspection Service (2001). GIPSA Directive 9181.1, Testing for StarLink-Corn-lateral flow test strip method, <http://151.121.3.117/reference-library/directives/9181-1.pdf>.