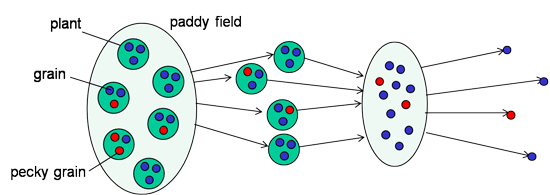
Figure 1. Schematic illustration of the sampling scheme of estimating the proportion of pecky rice grains.
| Sample size for estimatng the proportion of pecky rice grains |
Yamamura K, Ishimoto M (2009) Optimal sample size for composite sampling with subsampling, when estimating proportion of pecky rice grains in a field.
Journal of Agricultural, Biological, and Environmental Statistics 14:135-153.
[Preprint PDF(562KB)]
(Final version of manuscript) The original
publication is available at https://link.springer.com/article/10.1198/jabes.2009.0009
Problem in estiamtion
The proportion of pecky rice grains has been empirically estimated using
composite sampling with subsampling. The procedure is summarized as follows:
(1) a fixed number of rice plants (n1)
are drawn at random in the paddy field; (2) all the rice grains in the
collected rice plants are mixed well to form a composite; (3) a portion of the grains
(n2) are drawn at random
from the composite; and (4) the collected grains are examined by eye to
estimate the proportion of pecky rice grains. We propose a method to determine
the optimal sample size in estimating the proportion of defective items by this
kind of composite sampling with subsampling.
Figure 1. Schematic illustration of the sampling scheme of estimating the
proportion of pecky rice grains.
Model
We use the following notations.
s = the number of grains
in the ith plant,
n1 = the number of drawn
rice plants,
n2 = the number of rice grains drawn from the composite,
Pi = the probability that
a rice grain around the ith plant is
pecky,
P0 = the average of Pi over the sampling field,
i.e., P0 = E(Pi)
c1 = the cost that is required to collect one rice plant,
c2= the cost that is required to examine one rice grain.
The expectation and the variance of the estimated proportion of P0 is given by
![]()
![]()
We regulate the precision of estimates by the relative precision that is
defined by the coefficient of variation (CV),
![]()
The proportion of pecky rice grains varies depending on the position in
the paddy field. We describe the spatial distribution of the proportion
of pecky rice grains by a gamma distribution as an approximation. We describe
the relation between the mean and variance by using Talyor's power law.
Let μ and σ2 be the spatial mean and variance of the number of insects, respectively.
Taylor's power law is defined by,
![]()
Then, we can obtain the combination of n1
and n2 that achieves the
relative precision D by
![]()
Example of calculation
We empirically consider that D = 0.25 is most appropriate as standard. We must estimate the costs (c1
and c2), to determine the
optimal sample size. About 60 seconds are required in drawing a rice plant and
in shelling the rice grains. About 0.12 seconds are required to examine a rice
grain on average. We thus use c1/c2 = 60/0.12 = 500. The grade of rice falls from the first grade to the second
grade if the proportion of pecky rice grains is larger than 0.001 Thus, we use Pc = 0.001.
We estimated the parameters of Taylor's power law from field data. The combination of n1 and n2 is shown by Fig. 2. We obtained the optimal sample size n1 = 58 and
n2 = 31000.
Figure 2. Sample size to achieve a given relative precision (D). The curves indicate the combination
of n1 and n2 that achieve D < 0.25 for all P0 in the range of P0
> Pc. Five curves for
different values of Pc are
shown. The solid circle indicates the optimal combination of n1 and n2 for Pc
= 0.001 and (c1/c2) = 500. The broken line
indicates a slope of −500. The shaded area indicates the nonexistent
combination of n1 and n2 where the required number
of drawn grains exceeds the total number of drawn grains, i.e., the region ofn2 > sn1.
The following parameters were used: s = 1400, a = exp(−2.19),
and b = 1.60.