The Intergovernmental Panel on Climate Change (IPCC) estimated
that the global mean surface air temperature will increase about 2 degrees C above
the 1990 level by 2100. Such an increase in temperature may result in an increase
in the number of generations per year of most insects. Several simulation models
have been constructed to predict the increase in the number of generations, but
these require a great deal of calculation to obtain estimates for many insect
species at various locations under various scenarios of global warming. This paper
proposes an analytical method to enable a quick estimation. Two assumptions are
used: (1) The developmental rate of insects is approximately given by a linear
function of temperature (T ), with a developmental zero (T0)
and a thermal constant (K ). (2) The increase in temperature is approximately
even throughout the year. Let m be the current annual mean temperature at a given
location, and Delta T the potential increase in temperature under global warming
at the location. If the temperature before the DT-rise
is higher than T0 in summer and lower than (T0-DT ) in winter, the increase in the number of generations per year, which is denoted
by DN,
is approximately given by
DN = DT[c + d (m - T0 )]/K,
where c and d are constants. The validity of the approximation is
checked using the "smoothed daily normals" in Japan obtained as a running
mean of 15 successive daily normals where a daily normal is defined as the averaged
daily temperatures for 30 years from 1960 to 1990. The estimates are c = 204.4 and d = 12.46. Using this formula, linear isoclines of DN are plotted in a graph of T0 versus K. By plotting the T0 and K of various insects in this graph, we can estimate
the increase in the number of generations under global warming in temperate zones.
(Copyright by the Japanese Society of Applied Entomology and Zoology)
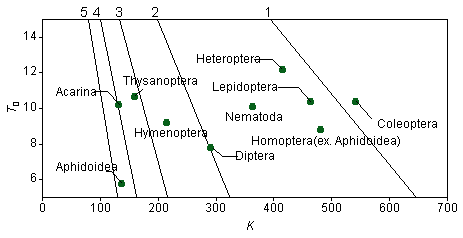
Figure 1. The effect of 2 degrees warming on the increase in the number
of generations at a location having a current annual mean temperature m = 15 degrees centigrade. Lines with numbers 1, 2, 3, 4, and 5 refer to the isoclines
showing the increase in the respective number of generations. Circles show the
mean value of T0 and K for different arthropod groups.